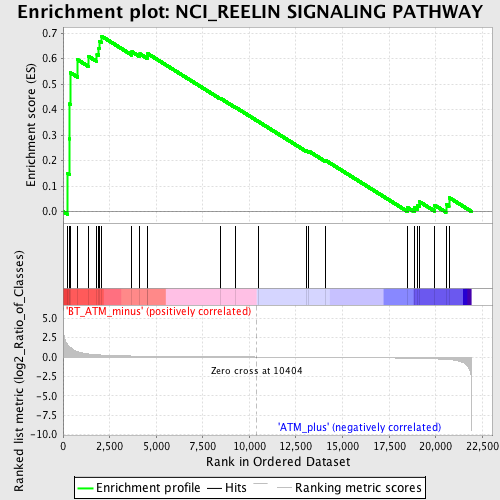
Profile of the Running ES Score & Positions of GeneSet Members on the Rank Ordered List
| Dataset | Set_02_BT_ATM_minus_versus_ATM_plus.phenotype_BT_ATM_minus_versus_ATM_plus.cls #BT_ATM_minus_versus_ATM_plus.phenotype_BT_ATM_minus_versus_ATM_plus.cls #BT_ATM_minus_versus_ATM_plus_repos |
| Phenotype | phenotype_BT_ATM_minus_versus_ATM_plus.cls#BT_ATM_minus_versus_ATM_plus_repos |
| Upregulated in class | BT_ATM_minus |
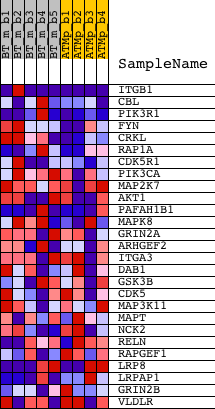
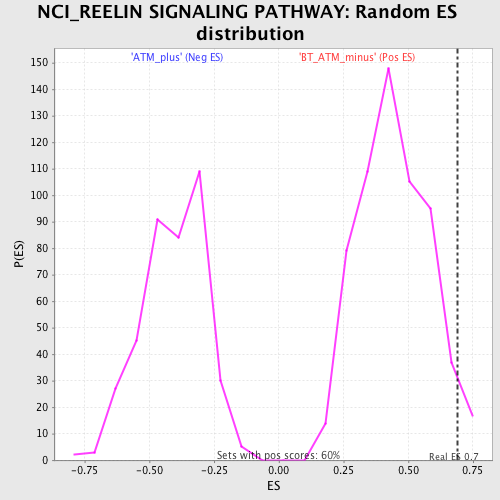
| GeneSet | NCI_REELIN SIGNALING PATHWAY |
| Enrichment Score (ES) | 0.68854386 |
| Normalized Enrichment Score (NES) | 1.5447162 |
| Nominal p-value | 0.0397351 |
| FDR q-value | 0.73798 |
| FWER p-Value | 1.0 |
| PROBE | DESCRIPTION (from dataset) | GENE SYMBOL | GENE_TITLE | RANK IN GENE LIST | RANK METRIC SCORE | RUNNING ES | CORE ENRICHMENT | |
|---|---|---|---|---|---|---|---|---|
| 1 | ITGB1 | 1426918_at 1426919_at 1426920_x_at 1427771_x_at 1438119_at 1452545_a_at | 251 | 1.572 | 0.1493 | Yes | ||
| 2 | CBL | 1434829_at 1446608_at 1450457_at 1455886_at | 334 | 1.363 | 0.2850 | Yes | ||
| 3 | PIK3R1 | 1425514_at 1425515_at 1438682_at 1444591_at 1451737_at | 343 | 1.346 | 0.4223 | Yes | ||
| 4 | FYN | 1417558_at 1441647_at 1448765_at | 398 | 1.220 | 0.5447 | Yes | ||
| 5 | CRKL | 1421953_at 1421954_at 1425604_at 1436950_at | 786 | 0.670 | 0.5956 | Yes | ||
| 6 | RAP1A | 1424139_at | 1364 | 0.391 | 0.6092 | Yes | ||
| 7 | CDK5R1 | 1421123_at 1421124_at 1433450_at 1433451_at | 1817 | 0.291 | 0.6183 | Yes | ||
| 8 | PIK3CA | 1423144_at 1429434_at 1429435_x_at 1440054_at 1453134_at 1460326_at | 1919 | 0.273 | 0.6416 | Yes | ||
| 9 | MAP2K7 | 1421416_at 1425393_a_at 1425512_at 1425513_at 1440442_at 1451736_a_at 1457182_at | 1939 | 0.269 | 0.6683 | Yes | ||
| 10 | AKT1 | 1416657_at 1425711_a_at 1440950_at 1442759_at | 2060 | 0.252 | 0.6885 | Yes | ||
| 11 | PAFAH1B1 | 1417086_at 1427703_at 1439656_at 1441404_at 1444125_at 1448578_at 1456947_at 1460199_a_at | 3694 | 0.127 | 0.6270 | No | ||
| 12 | MAPK8 | 1420931_at 1420932_at 1437045_at 1440856_at 1457936_at | 4125 | 0.111 | 0.6188 | No | ||
| 13 | GRIN2A | 1421616_at | 4539 | 0.099 | 0.6100 | No | ||
| 14 | ARHGEF2 | 1421042_at 1421043_s_at 1427646_a_at | 4549 | 0.098 | 0.6197 | No | ||
| 15 | ITGA3 | 1421997_s_at 1455158_at 1460305_at | 8439 | 0.026 | 0.4449 | No | ||
| 16 | DAB1 | 1421100_a_at 1427307_a_at 1427308_at 1435577_at 1435578_s_at | 9254 | 0.015 | 0.4093 | No | ||
| 17 | GSK3B | 1434439_at 1437001_at 1439931_at 1439949_at 1451020_at 1454958_at | 10465 | -0.001 | 0.3541 | No | ||
| 18 | CDK5 | 1422590_at 1450674_at | 13046 | -0.035 | 0.2399 | No | ||
| 19 | MAP3K11 | 1450669_at | 13197 | -0.037 | 0.2368 | No | ||
| 20 | MAPT | 1417885_at 1424718_at 1424719_a_at 1445634_at 1455028_at | 14093 | -0.050 | 0.2011 | No | ||
| 21 | NCK2 | 1416796_at 1416797_at 1458432_at | 18505 | -0.150 | 0.0151 | No | ||
| 22 | RELN | 1449465_at 1458020_at | 18871 | -0.164 | 0.0152 | No | ||
| 23 | RAPGEF1 | 1421146_at 1427006_at 1441386_at | 19031 | -0.171 | 0.0254 | No | ||
| 24 | LRP8 | 1421459_a_at 1440882_at 1442347_at | 19149 | -0.176 | 0.0381 | No | ||
| 25 | LRPAP1 | 1426696_at 1426697_a_at 1436609_a_at 1452148_at | 19946 | -0.231 | 0.0254 | No | ||
| 26 | GRIN2B | 1422223_at 1431700_at | 20563 | -0.305 | 0.0285 | No | ||
| 27 | VLDLR | 1417900_a_at 1434465_x_at 1435893_at 1438258_at 1442169_at 1451156_s_at | 20724 | -0.332 | 0.0552 | No |